

Introduction
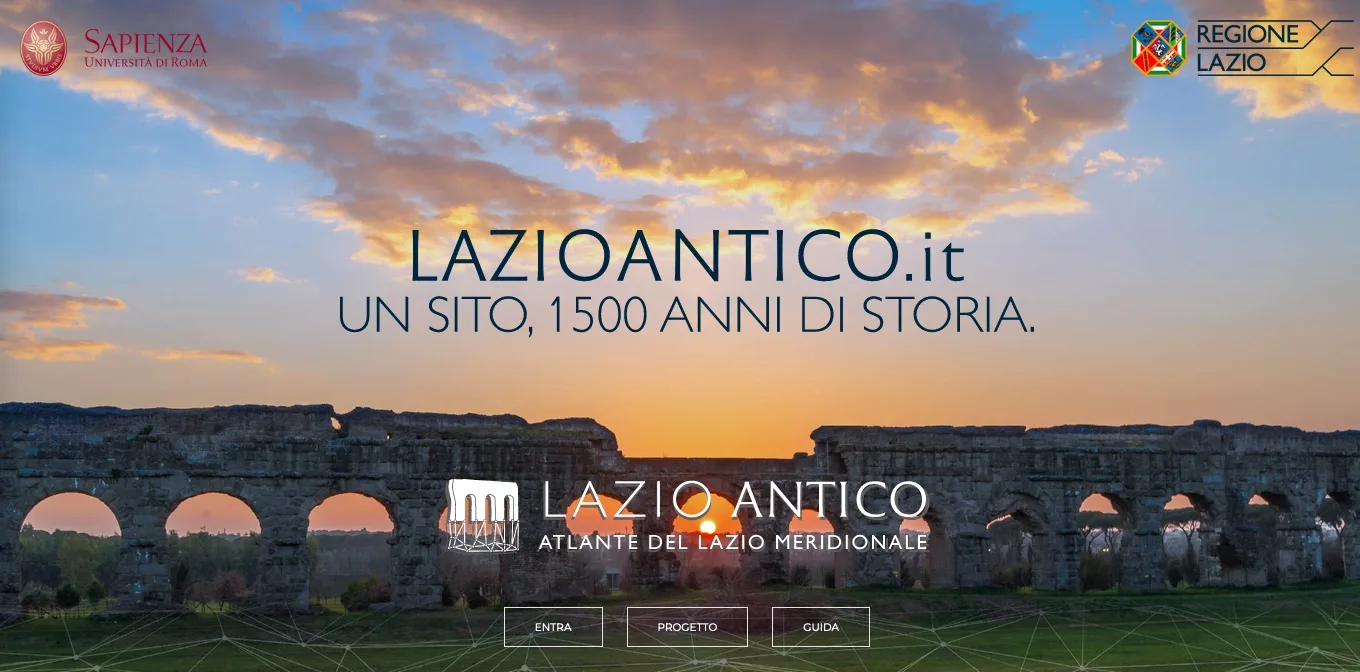
The Lazio Antico portal (https://lazioantico.datascape.dev/) is the result of the eponymous project, made possible by a specific inter-institutional agreement through which the Lazio Region and Sapienza University of Rome pooled their resources and expertise in order to enhance research in the field of Cultural Heritage and to facilitate young researchers’ entry into the field.
The portal was officially presented on 16 December 2021 in the Aula Magna of Sapienza University of Rome, in the presence of the Minister of Culture Dario Franceschini, the President of the Lazio Region Nicola Zingaretti, the Rector of Sapienza University of Rome Antonella Polimeni, the Vice-Rector for Archaeological Heritage of Sapienza University of Rome Paolo Carafa, the Vice-Rector for Research of Sapienza University of Rome Maria Sabrina Sarto, and the President of FAI, Professor Emeritus Andrea Carandini.
Quoting the website:
Lazio Antico offers a complete digital mapping of the archaeological heritage, sites and features relating to the ancient world in a period ranging from the mid-9th century BC to the mid-6th century AD. Lazio Antico currently covers the entire territory of Lazio south of the Tiber, and may be extended to the whole Region in a second phase of the project.
The portal is organized into two sections: a first welcome page that offers institutional information and an important summary of the data collected so far (see below); it also contains a video that very effectively demonstrates how to use it. The atlas proper is structured as a Single Page Application built around a dynamic map of ancient Lazio, on which archaeological evidence is represented in detail rather than symbolically.
The dynamic map offers various viewing modes, both in 2D, with the classic zenithal view, and in 3D, with the possibility of tilting the point of view almost to skim the terrain. The archaeological evidence is placed on a base map that reconstructs what the ancient landscape must have looked like, on which the areas pertaining to each individual settlement are shown — calculated, with the exception of the territory of Rome itself, using Voronoi polygons. It is also possible to replace the base map with a present-day photographic base, a very useful tool for comparing changes over time: the example of the mouth of the Tiber is a highly instructive case.
It is also possible to display short summary sheets for each of the territories, using the footer menu (the Territori item) and selecting the territory from the list that opens on the right. This list is synchronized with the map, so it is enough to move around the map or zoom in and out to update the list.
In a similar way, it is possible to browse and consult the sheets dedicated to the many reconstructed monuments (the Ricostruzioni item). In this case, the short textual description is accompanied by one or more attachments in the form of raster images containing the plan and elevation drawings dedicated to the individual structure, using the same graphic language developed and effectively employed in the earlier Atlante di Roma (Princeton University Press 2017).
It is possible to filter the data by chronology, using a very useful widget located at the bottom of the screen, by simply dragging the short sides and/or dragging the active chronology window itself. In real time, the evidence displayed on screen is filtered, hidden or shown. This is a very useful feature that makes it extremely easy to also visualize the fourth dimension, namely time.
Finally, the map is implemented with a series of icons that make it easier to read the type of remains displayed. Indeed, each archaeological element shown on the map is paired with a point marker to which the main information for that element is linked: the identifier, the chronology when available, the type, and the graphic sheets when available.
The data
At the time this review was written (February 2022), and according to the information published on the site’s home page, the portal collects and publishes:
- more than 300,000 base records;
- more than 41,000 aggregated objects;
- around 70 towns/settlements and their respective territories;
- around 150 reconstructed monuments in nearly 200 plates;
- 16 classes of archaeological complexes (Vocaboli), broken down into 184 subclasses.
This data refers to the area of Lazio south of the Tiber river, which was taken as one of the geographical boundaries of the present project. This limit will soon be removed as research continues, as was announced at the project’s official presentation on 16 December 2021.
At present the data can be viewed through the website but cannot be accessed as an external service in a Desktop GIS or in other web or non-web applications (WFS/WCS/API, etc.).
The platform
No information about the technology used to build the web application has been published on the site, but it is clearly a JavaScript-based application. In particular, Mapbox GL JS — a JavaScript library that was open source until recently — is used for the map’s functionality.
The distribution of the geographic data likewise relies on a Mapbox service, namely Mapbox Tiling Service.
References
- Main page of the portal: https://lazioantico.datascape.dev/
- Page on the website of the Department of Sciences of Antiquity, Sapienza University of Rome, dedicated to the project: https://www.antichita.uniroma1.it/progetto-lazio-antico-paesaggi-urbani-e-rurali-antichi-nella-regione-lazio-analisi-ricostruzione-e
- News of the project’s presentation, on the website of the Lazio Region: https://regione.lazio.it/notizie/cultura-regione-sapienza-roma-lazio-antico