

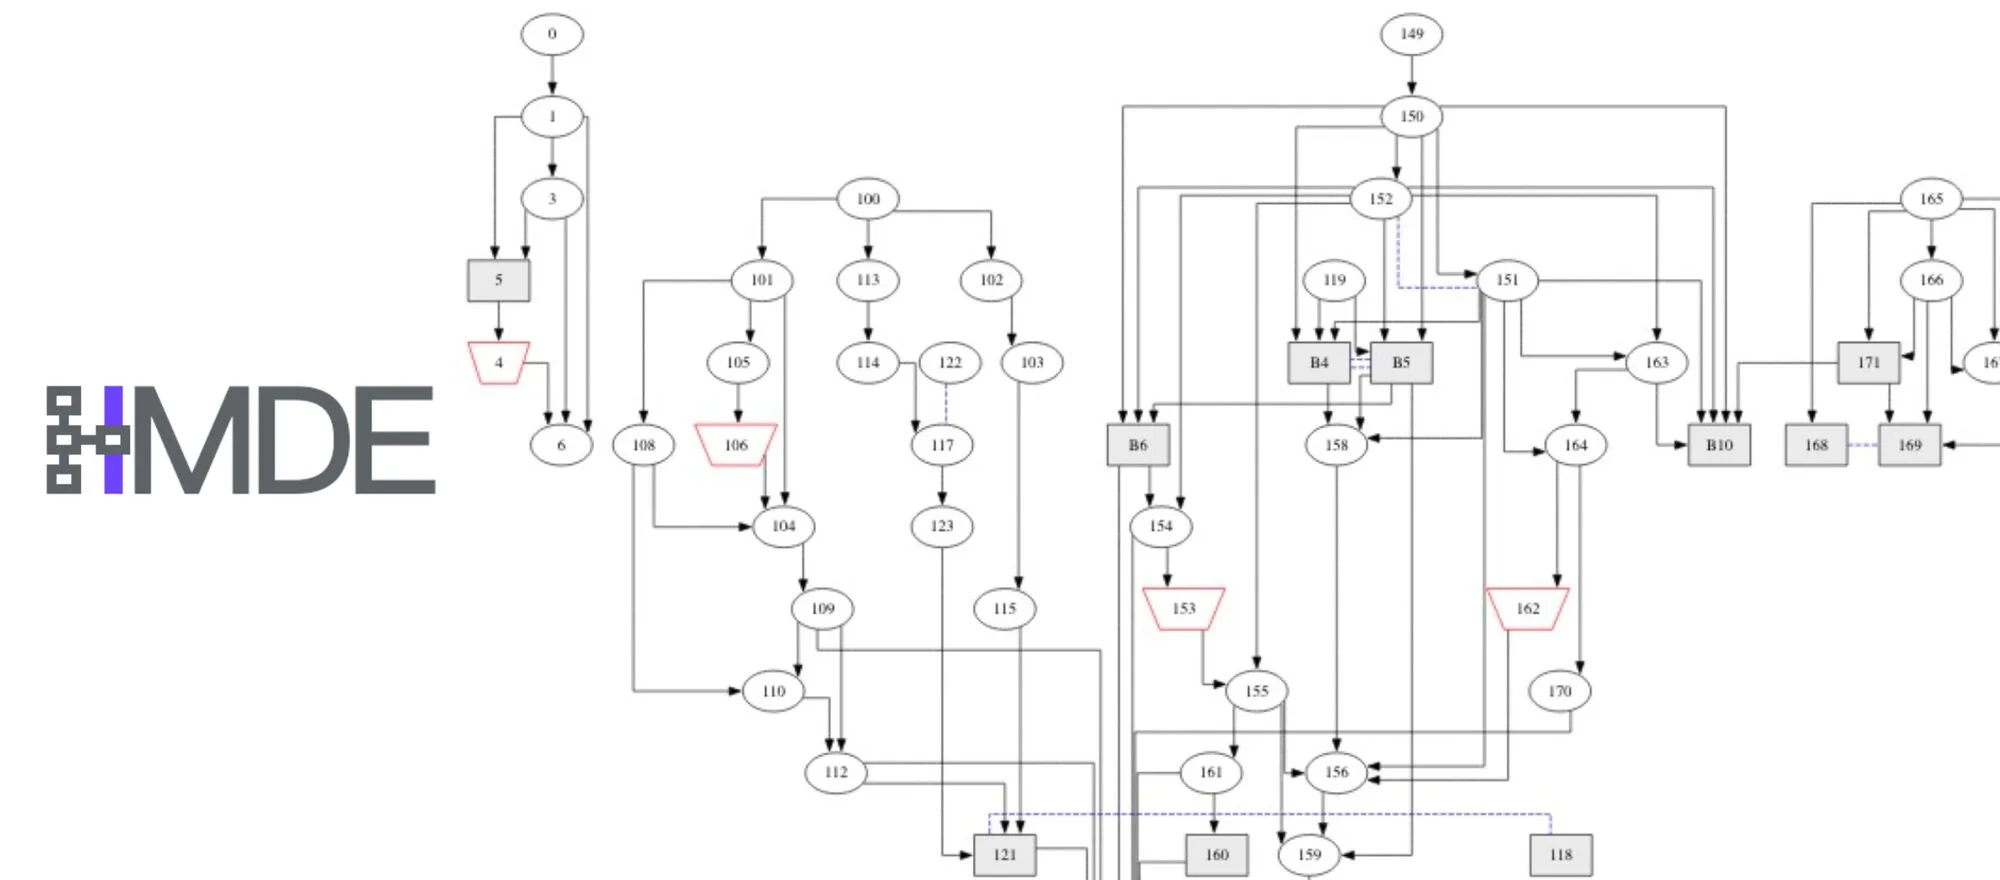
For more than a year now, the LAD team has been trialling the Directus.io platform for relational data management on the archaeological excavation of Çuka e Ajtoit, in southern Albania. The platform is being used successfully to collect the data produced during excavation, survey, and the analysis and study carried out in the lab and in the library on archaeological contexts. Among this data, stratigraphic data is naturally also collected, managed and analysed. The tabular view — the default one in Directus.io — of this type of record is awkward and not very useful or informative. For this reason, we sought to extend Directus.io so as to represent the recorded stratigraphy in the form of a Harris Matrix, a format that is certainly more useful and familiar. To this end, a plugin was developed as part of a bachelor’s thesis, released under an open source license (GNU AGPL v.3.0) in order to share this achievement with the community and to gather feedback and contributions for its future development.
Directus.io
Directus.io is a platform intended to make relational databases accessible to users who do not necessarily have particular technical skills. According to the definition given by the team that develops it:
Directus is an Open Data Platform built to democratize the database.
The main use one can make of it on an excavation is to facilitate data entry operations even for operators without specific (IT) training. Directus.io is an open-source tool, extremely well supported and (under certain conditions) usable free of charge. It therefore potentially represents a remarkable and accessible solution for the data-collection phases. If configured well, the platform’s intuitive forms can facilitate the contextual entry of whatever needs to be recorded during fieldwork, without this becoming a further complication for those working on site.
Stratigraphy as a relational construct
As far as stratigraphy is concerned, it is very easy to imagine a more or less complex tabular structure that can hold records relating to the characteristics of stratigraphic units but also, and above all, their mutual physical relationships. The relational paradigm is dominant when it comes to storing this type of data, and Directus.io allows the creation of schemas perfectly suited to this need.
Directus.io, however, was not designed specifically to handle stratigraphic data. It is, rather, an extremely versatile general purpose platform and therefore entirely generic. For an instance of Directus.io to be adapted to the specific needs of an archaeological excavation, it must be extended.
Custom layouts
When dealing with complex data, the first and most immediate need to address is naturally that of its visualization. It is evident that visualizing stratigraphic data as a graph, in the typical form of the Harris Matrix, is preferable to the dry tabular representation of relationships.
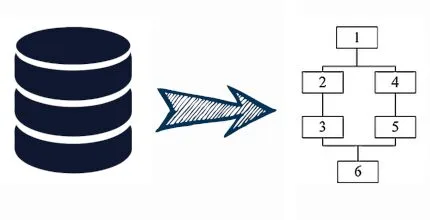
Directus.io allows for a wide range of Layouts — that is, ways of graphically representing lists of items — that can be associated with data, meaning that any table can be presented in one of the predefined formats, provided the layouts are configured to know how to give meaning to the data contained in the records. The original layouts are Calendar, Cards, Kanban, Map and Table, which is the default one. Once the layout of interest has been selected, one simply needs to tell the platform which column of the record should populate each particular graphic element of the chosen representation. For example, if we choose the Map layout and our table has columns relating to the geographic location of the record, then it is enough to indicate which of them should be considered the source of the latitude data and which the source of the longitude data for the marker representing the record.
Let us take the case of a table with two geolocated records.

The tabular representation is not the only one available.
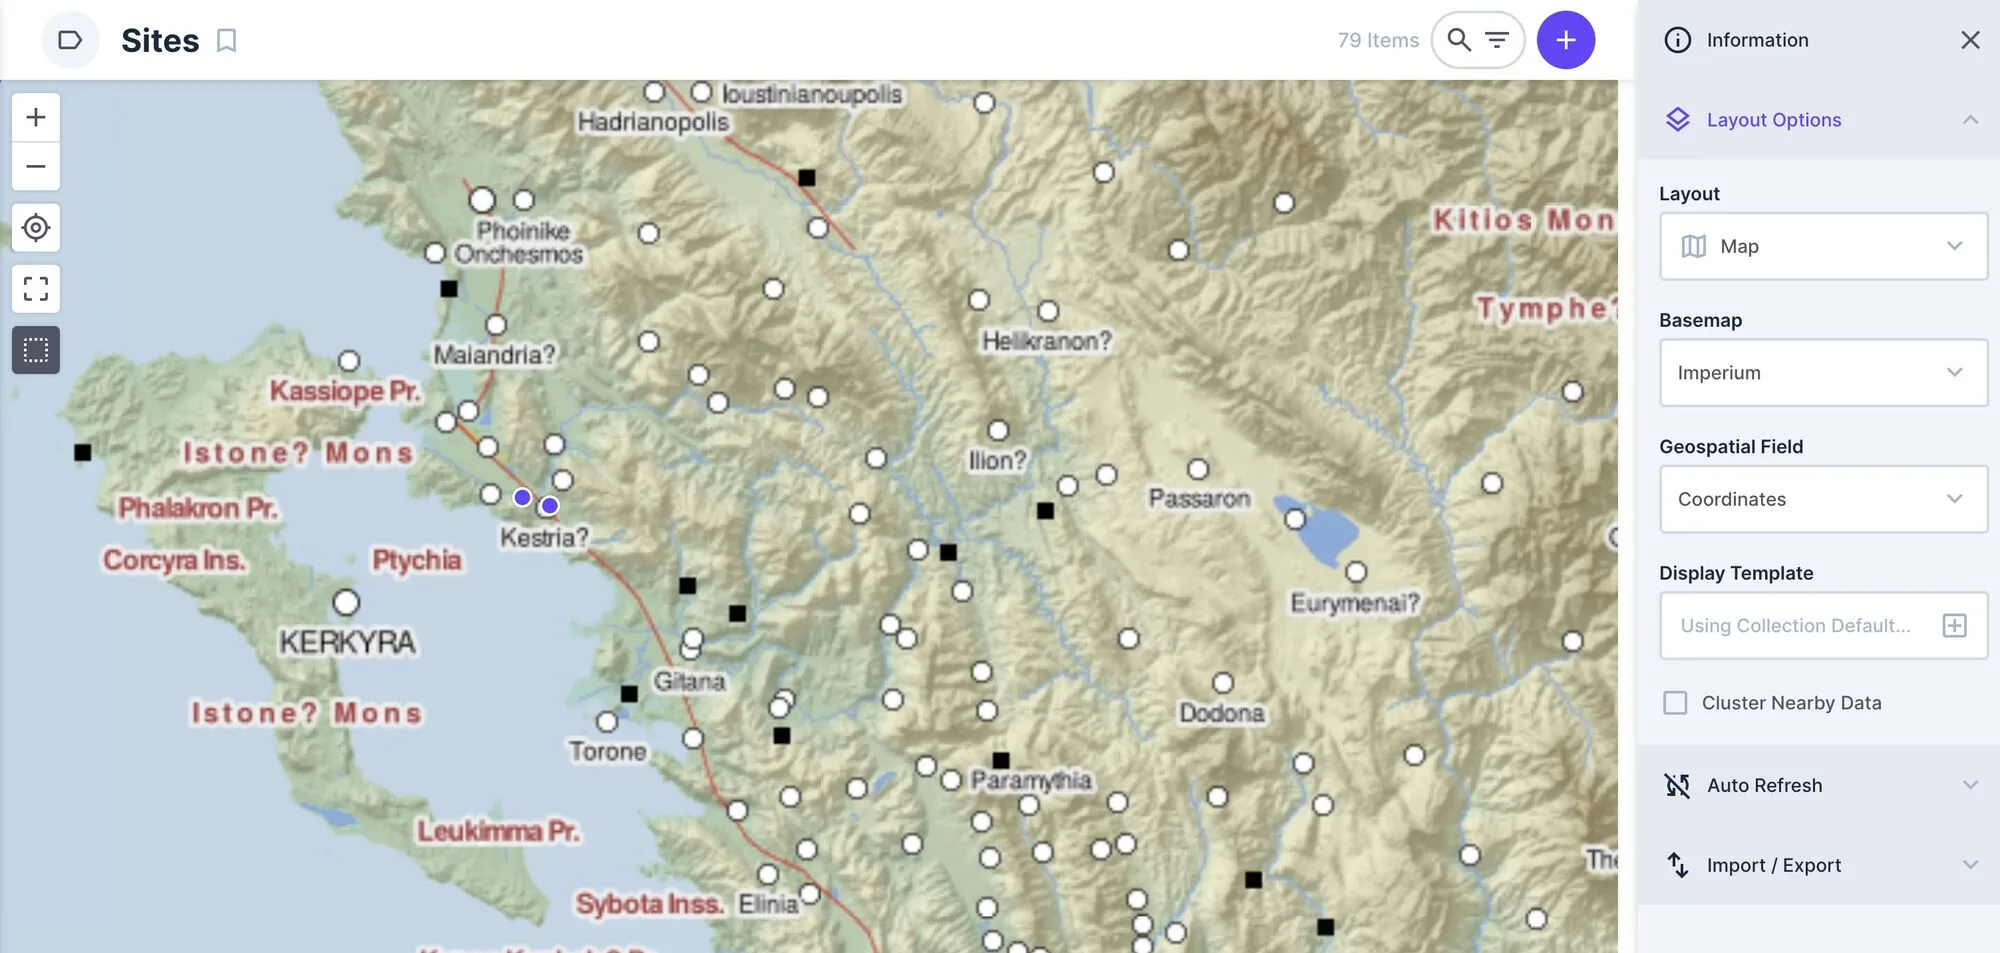
In the images above we can see how simply using Directus.io’s layouting feature makes it possible to move from a cold, unwieldy tabular form to a very interesting map-based representation, which allows for some further customization (in the second image we used a base map, namely the DARE: Digital Atlas of Roman Empire). Fortunately, this mechanism is extensible, and as we shall see, it was possible to produce an additional layout that displays the data in the form of a Harris Matrix. Directus.io refers to this kind of extension with the term Custom layouts.
The HMDE
The HDME, or Harris Matrix Directus Extension, is therefore a custom layout for Directus.io that represents stratigraphic data in the form most familiar to archaeologists today, namely the directed graph. As mentioned, it is enough to tell the platform which columns hold data such as the identifier of the Stratigraphic Unit, its description, etc.
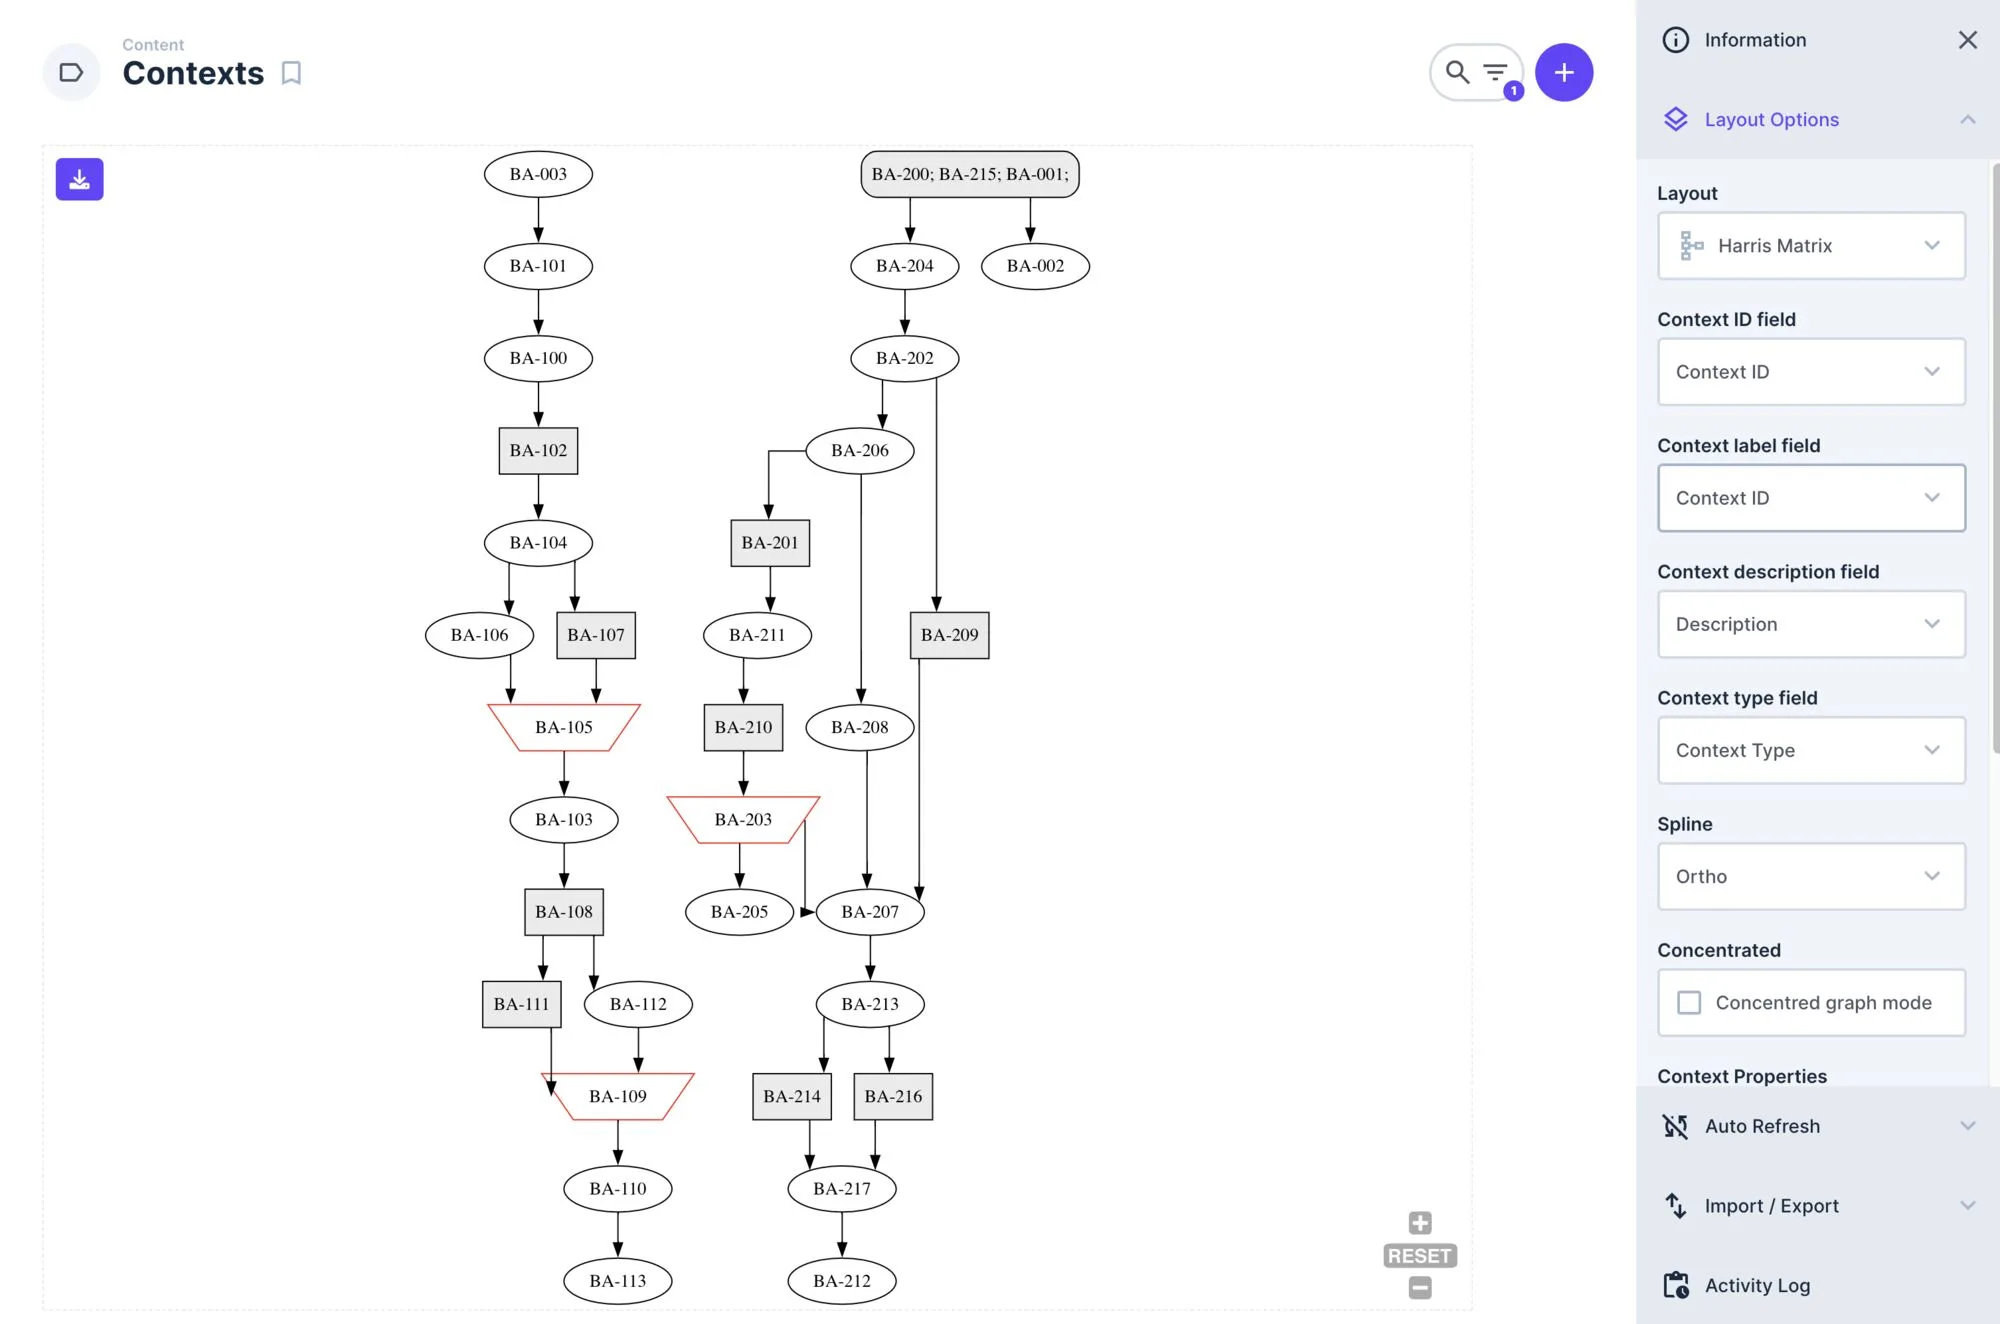
A number of specifications also need to be followed when modelling the tables one wants to represent. These specifications are described in a video tutorial available below, as well as on the project’s GitHub page, which also contains detailed instructions for installing the extension on a dockerized instance of Directus.io.
The already-compiled Node.js module is currently available on HMDE’s releases page, as well as on the free NPM.js registry.
Where can we go from here?
HMDE is a project that is (still) not very refined and which certainly does not yet exploit all the potential that emerged during the months of analysis and development. Many improvements can be made so that the extension increasingly better meets the needs of the people working on the excavation. Above all, many theoretical considerations that have only just been sketched out could be explored further and applied along a path toward developments that, today, we may not yet be able to foresee.
We would like to close this contribution by touching on an area that was certainly addressed during development, but not explored as deeply as we would have liked: the application of Graph Theory to the treatment of stratigraphic representation. This is not the place for more than a passing mention, but the idea that a Harris Matrix, to be one, must be conceived as the transitive reduction of a directed acyclic graph almost forced us to venture into the field of mathematics. Once we entered that territory, a wide and fascinating range of possibilities opened up before us.
Of these possibilities, as mentioned, we have only managed to scratch the surface: we hope to be able to return to these topics as soon as possible.
Stay tuned
Resources
Directus.io
- Directus.io official website https://directus.io/
- Introduction to Directus.io Custom layouts https://docs.directus.io/extensions/layouts.html HMDE
- GitHub repository dedicated to HMDE https://github.com/lab-archeologia-digitale/directus-extension-harris-matrix
- NPM.js repository dedicated to HMDE https://www.npmjs.com/package/directus-extension-harris-matrix
- Report a bug https://github.com/lab-archeologia-digitale/directus-extension-harris-matrix/issues
- List of HMDE releases available: https://github.com/lab-archeologia-digitale/directus-extension-harris-matrix/releases Graph theory
- Treccani entry on Graph Theory https://www.treccani.it/enciclopedia/teoria-dei-grafi_(Enciclopedia-della-Scienza-e-della-Tecnica)/
- Britannica entry on Graph Theory https://www.britannica.com/topic/graph-theory#ref909835
- Introduction to the concept of Transitive reduction https://www.cs.tufts.edu/comp/150FP/archive/al-aho/transitive-reduction.pdf DARE
- DARE: Digital Atlas of Roman Empire: https://dh.gu.se/dare/